What is continuous improvement?
Continuous improvement (CI) is the practice of systematically identifying and eliminating inefficiencies, defects, and waste from manufacturing processes. It is not a one-time project or a destination. It is a philosophy and a set of habits where every person in the organization looks for opportunities to work better, smarter, and faster.
The alternative is batch improvement: waiting for a crisis or a scheduled "improvement initiative," bringing in consultants, running a project for three months, then returning to normal operations until the next crisis hits. Batch improvement is expensive, slow, and creates organizational fatigue.
Manufacturing companies that excel at continuous improvement do not have a separate "improvement department." They have an improvement mindset embedded in how operators, supervisors, and engineers spend their time. Improvement is part of everyone's job, every shift, every day.
Origins: Deming, Kaizen, and PDCA
The intellectual roots of continuous improvement run through three figures and one framework that tied them together.
W. Edwards Deming, an American statistician working in postwar Japan, taught that the biggest source of manufacturing problems was not worker laziness or poor intention, but flawed systems. He argued that management's job was to understand and improve those systems, not blame workers. He introduced the Plan-Do-Check-Act (PDCA) cycle as the fundamental rhythm of improvement.
Kaizen is a Japanese word meaning "good change." In manufacturing, it refers to the practice of continuous, incremental improvement. Unlike large capital projects, Kaizen improvements are often small, low-cost, and proposed by people on the floor. They accumulate to massive impact over time. Kaizen became foundational to the Toyota Production System and Japanese manufacturing excellence in the 1970s and 1980s.
PDCA (Plan, Do, Check, Act) became the universal improvement cycle used across methods and industries. Plan the change, test it on a small scale, check if it worked, and either act to standardize it or plan a different approach. PDCA repeats infinitely. Every improvement generates learning that fuels the next improvement.
Methodologies: PDCA, DMAIC, A3, and Kaizen events
Different methodologies have emerged for different types of problems. The best organisations know which tool to use when.
PDCA
Plan a small test, run it, check the results, and act on what you learn. The simplest cycle. Used for quick experiments, rapid iteration, and building the improvement habit. Most effective for problems with known solutions that need validation.
DMAIC
Define the problem, Measure the current state, Analyse root cause, Improve by testing solutions, Control by standardizing and monitoring. More structured than PDCA. Used for complex problems, data-heavy analysis, and projects that cross departments. Common in Lean Six Sigma programs.
A3 thinking
Named for the paper it is typically printed on, A3 is a method for breaking down a problem, showing root cause visually, and proposing countermeasures. Forces clarity and discipline. Used in Toyota and companies trained by Toyota. Excellent for mentoring and decision-making.
Kaizen events
Intensive, week-long bursts of structured improvement focused on a specific process. A cross-functional team dedicates time, collects data, maps the process, identifies waste, and tests rapid improvements. Generates momentum and visible results quickly.
None of these methods is universally "best." PDCA is fast for incremental improvements. DMAIC handles complexity. A3 teaches problem-solving discipline. Kaizen events build engagement and culture. Most mature organisations use all of them, switching based on problem size and data needs.

Problem-solving tools
Every CI methodology relies on a toolkit of techniques to understand problems and generate solutions. Learning these tools is essential for effective improvement.
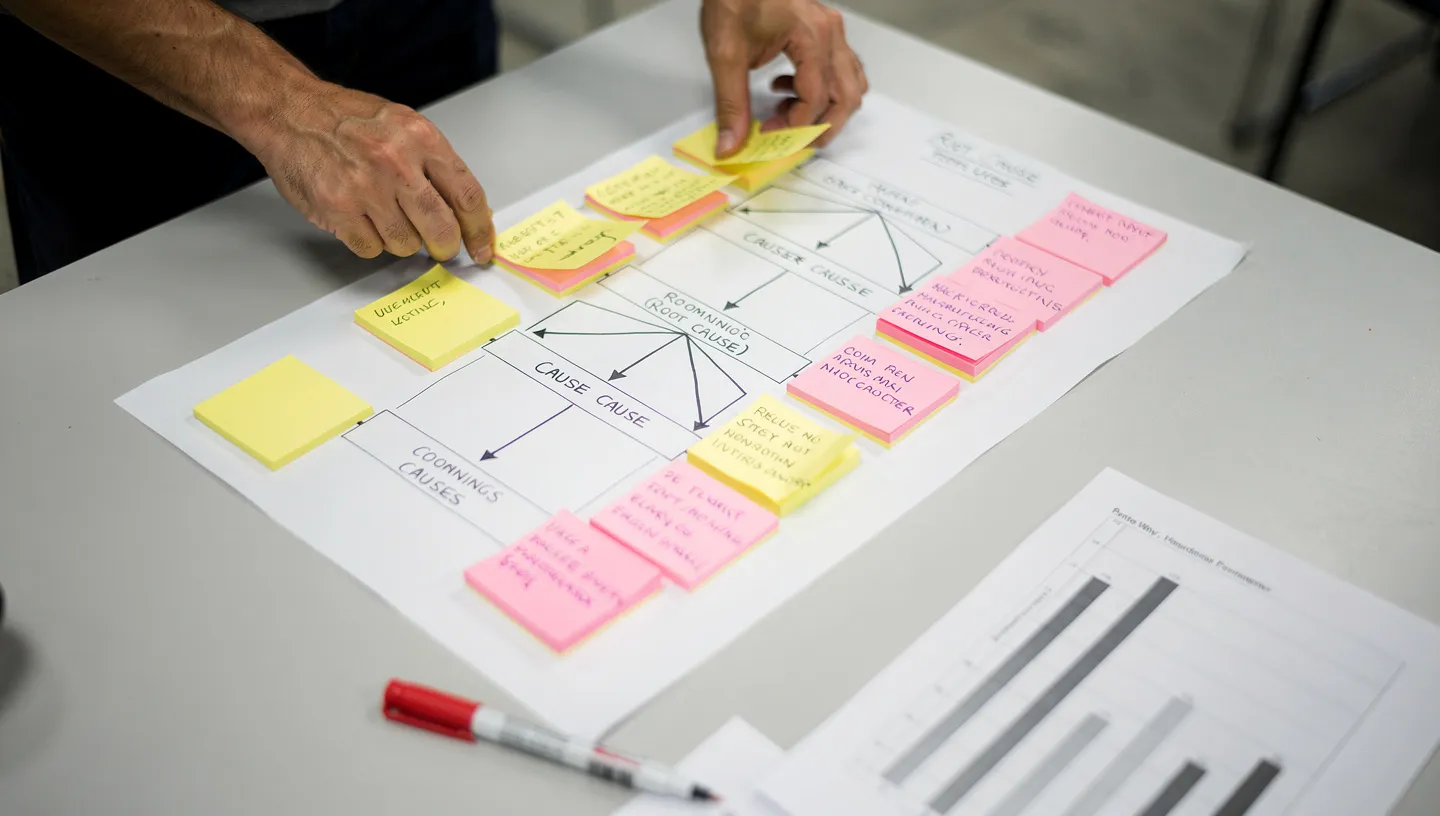
Five Why
Ask "why" repeatedly, without judgment, to dig from the symptom to root cause. Why did the machine stop? Loss of hydraulic pressure. Why was there pressure loss? Hose ruptured. Why did it rupture? It was rubbing against a sharp edge. Why was the hose in contact with the edge? The bracket that guides it was installed incorrectly. Why was it installed wrong? No standard for bracket installation, and the mechanic guessed. Fifth why: lack of documentation. The fifth (or sixth, or seventh) why typically points to a systemic problem, not a one-time accident.
Fishbone diagram (Ishikawa)
A structured brainstorm that organizes potential causes into categories: Materials, Methods, Machines, People, Measurement, and Environment. Draws a visual map of possibilities. Prevents the conversation from fixating on one suspected cause and missing other contributors.
Pareto chart (80/20 analysis)
Sort problems by frequency or impact. Typically, 80% of the effect comes from 20% of the causes. A Pareto chart forces prioritization. Do not fix all problems equally. Fix the biggest one first. Maecos dashboards make Pareto easy: show downtime by category, scrap by defect type, or safety incidents by location. The biggest bar is where to focus.
Process mapping (VSM)
Draw the actual flow of material and information. Value Stream Mapping shows the current state, identifies waiting, handoffs, and rework. Future state mapping imagines what the process should look like. The gap between current and future is the improvement roadmap.
Run charts and control charts
Plot data over time to spot trends. Is quality getting worse? Is changeover time stable or drifting? Control charts add statistical limits to distinguish normal variation from signals that warrant investigation.
Building a continuous improvement culture
Methods and tools are necessary but not sufficient. The limiting factor is culture: whether people feel empowered to improve, whether improvement ideas are treated as valuable, and whether the organisation can sustain effort past the initial enthusiasm.
Building CI culture starts with leadership belief and modelling. If the plant manager attends a Kaizen event and acts on the results, the whole organisation notices. If CI work is squeezed by the need to meet daily production, it dies. Leaders must protect time for improvement and celebrate progress publicly.
Second, create a system for capturing ideas. Not all ideas need formal approval or a project. Some should be tried immediately by the person who suggested them. Others need analysis. A simple system (online form, suggestion board, even a email) and clear next steps (we will review this on Friday, we will test this next week) shows that ideas matter.
Third, make improvement part of daily rituals. Morning meetings review yesterday's problems and day's priorities. Weekly gemba walks see the process firsthand and collect observations. Monthly improvement reviews check progress. These rituals normalize problem-solving and create accountability.
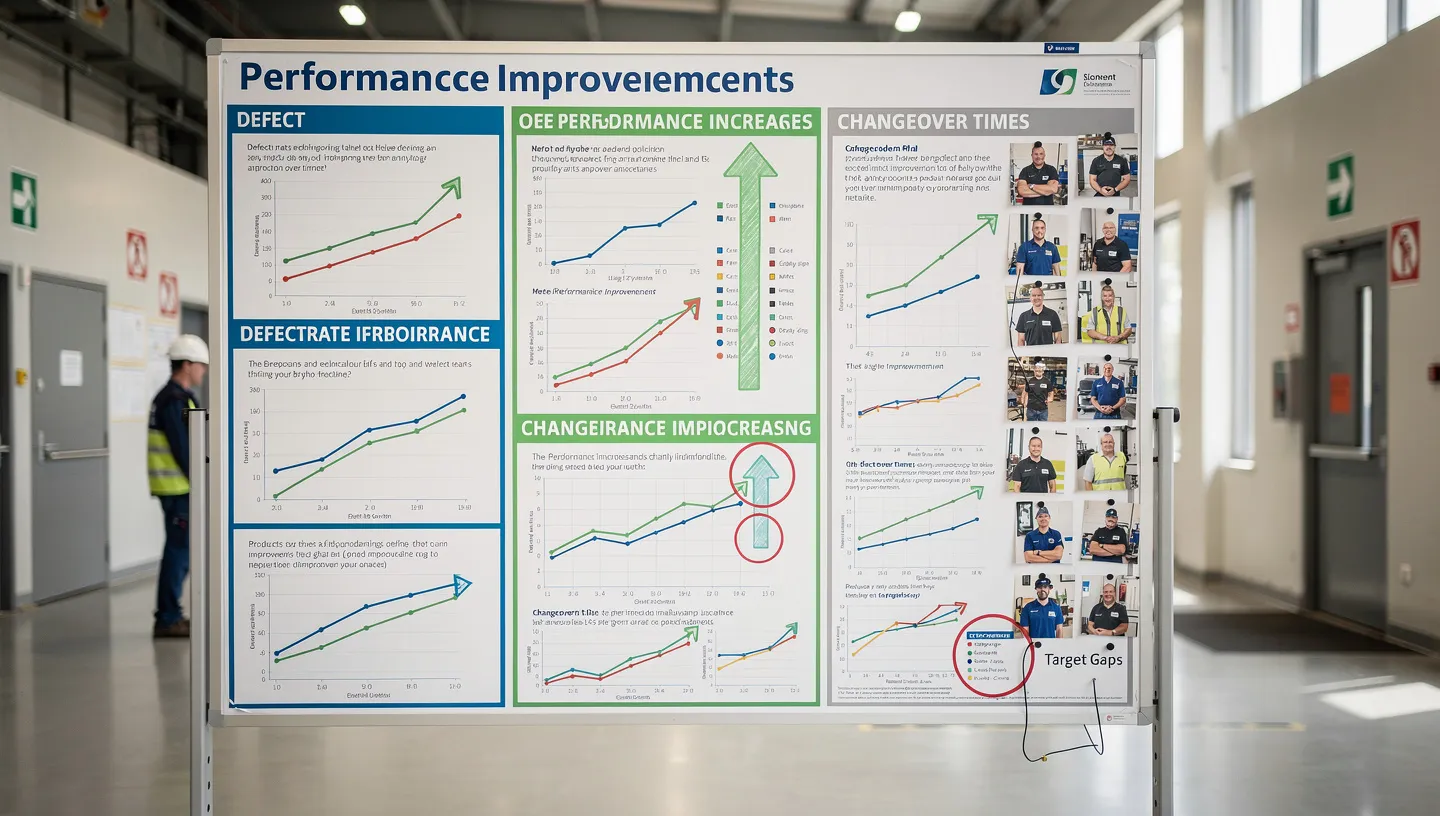
Fourth, celebrate progress visually. Post charts showing improvement trends. Display before-and-after photos of workspace changes. Publicly recognise teams that have completed improvements. Make it obvious that the organisation values better performance and sees it as coming from people's ideas.
The role of standards in continuous improvement
Standards and continuous improvement are not opposites. They are partners.
A standard is the best way to do something that we have found so far. It documents what works: the steps, the timing, the checks. It makes improvement visible: if actual performance differs from standard, something is wrong. It distributes knowledge: new people learn from the standard instead of reinventing. It is the baseline for improvement: you cannot improve what is not standardized, because you cannot measure whether you actually improved.
The CI cycle generates new standards. When an improvement is validated and working, it gets written down. The standard becomes the new baseline. The next improvement improves upon this new standard. This is how organisations climb: each CI cycle raises the floor.
The problem occurs when standards become rigid. A standard written five years ago that no one thinks to question because "that is how we do it" is a standard that blocks improvement. The best organisations review standards regularly: Does this still make sense? Can we simplify? Have we learned something that should change how we do this?
Common pitfalls
Organisations trying to build continuous improvement often stumble on predictable mistakes:
Improvement without stability
If the process is chaotic and unpredictable, improvement is impossible. You test a change, it works once, then it does not work the next day because someone is not following the standard or conditions changed. Invest in stability first. Get the process predictable. Then improve.
Confusing activity with progress
Running a Kaizen event and creating an improvement plan feels productive. But if the improvement does not get implemented or sustained, it was just activity. Track completion, not just initiation. Measure results, not effort.
Improvement from above only
Management selects the improvements to work on. Engineers design the solutions. Operators implement. This is more efficient in the short term, but it misses the best ideas (which come from people doing the work) and creates no engagement. The best organisations push authority down: operators identify problems, operators propose solutions, management supports and removes blockers.
Treating failures as mistakes instead of learning
An improvement is tested, it does not work, and the improvement is abandoned with embarrassment. Actually, the test generated valuable learning. Why did it not work? What did we learn? What should we try next? The improvement mindset treats failure as data, not defeat.
Improvement as a separate department
The plant hires an "Lean consultant" or creates a "Kaizen team" that is supposed to improve everything. Other departments see improvement as their job, not theirs. Results plateau because improvement is not integrated into daily work. Instead, invest in training frontline supervisors and operators to run their own improvements.
No connection between improvement and strategy
Improvements are scattered and uncoordinated. One area improves changeovers, another improves quality, another cuts costs, with no overall direction. The organisation ends up frustrated: lots of effort, unclear benefit. Connect improvements to strategic priorities. Align the Kaizen backlog to where the organisation needs to win.
Measuring continuous improvement effectiveness
If you cannot measure it, you cannot improve it. Effective CI requires metrics at multiple levels.
Activity metrics
How many improvement ideas were generated? How many were implemented? What is the completion rate? These show whether the CI system is working. A healthy plant should be running dozens of improvements every month, not dozens per year.
Impact metrics
What is the quantified benefit? Reduced downtime hours, defect rate improvements, safety incidents prevented, cost savings. Every completed improvement should have an estimated impact. Aggregate these to show annual benefit: if 100 improvements each saved an average of 40 hours, that is 4,000 hours annually, roughly equivalent to adding two full-time employees worth of capacity.
Process metrics
The underlying operations that CI improvements target: OEE, changeover time, first-pass yield, safety incidents, inventory days. These are the ultimate measures of improvement effectiveness. Activity and impact metrics are diagnostics. Process metrics are the actual business outcome.
Culture metrics
Percentage of people who have submitted an idea. Time from idea submission to decision. Percentage of ideas implemented. These show whether continuous improvement has embedded into daily work or remains a management program.
Continuous improvement and digital tools
For decades, continuous improvement relied on paper, whiteboards, and spreadsheets. These tools work for small plants and small improvements. But they do not scale, and they make it hard to sustain momentum.
Digital tools address five key gaps. First, they make data available. Paper-based systems obscure what is actually happening: where are the biggest problems, is quality getting better or worse, what did we learn from last month's improvements. Digital systems surfaced clean data that makes problem selection obvious.
Second, they create visibility. When improvement metrics are on a dashboard that everyone sees, progress becomes real. The Pareto chart of downtime by category is updated hourly, not monthly. The backlog of improvement ideas is visible to all, not locked in a spreadsheet. Transparency drives accountability.
Third, they connect improvement to operations. When a downtime event is logged in the system, it can be automatically linked to corrective action workflows, maintenance schedules, or improvement ideas. The organisation stops creating separate silos for problems, maintenance, and improvement.
Fourth, they enable rapid testing and standardization. Once an improvement is validated, the standard work instructions can be updated in the system immediately. All shifts, all sites, get the new method at the same time. No weeks of delay waiting for printed documents.
Fifth, they create organisational memory. Five years of improvement data is retained and searchable. New team members can see what problems have been solved and how. Patterns emerge: what types of improvements have the biggest impact, which teams are strongest at execution, where are the chronic recurring issues.