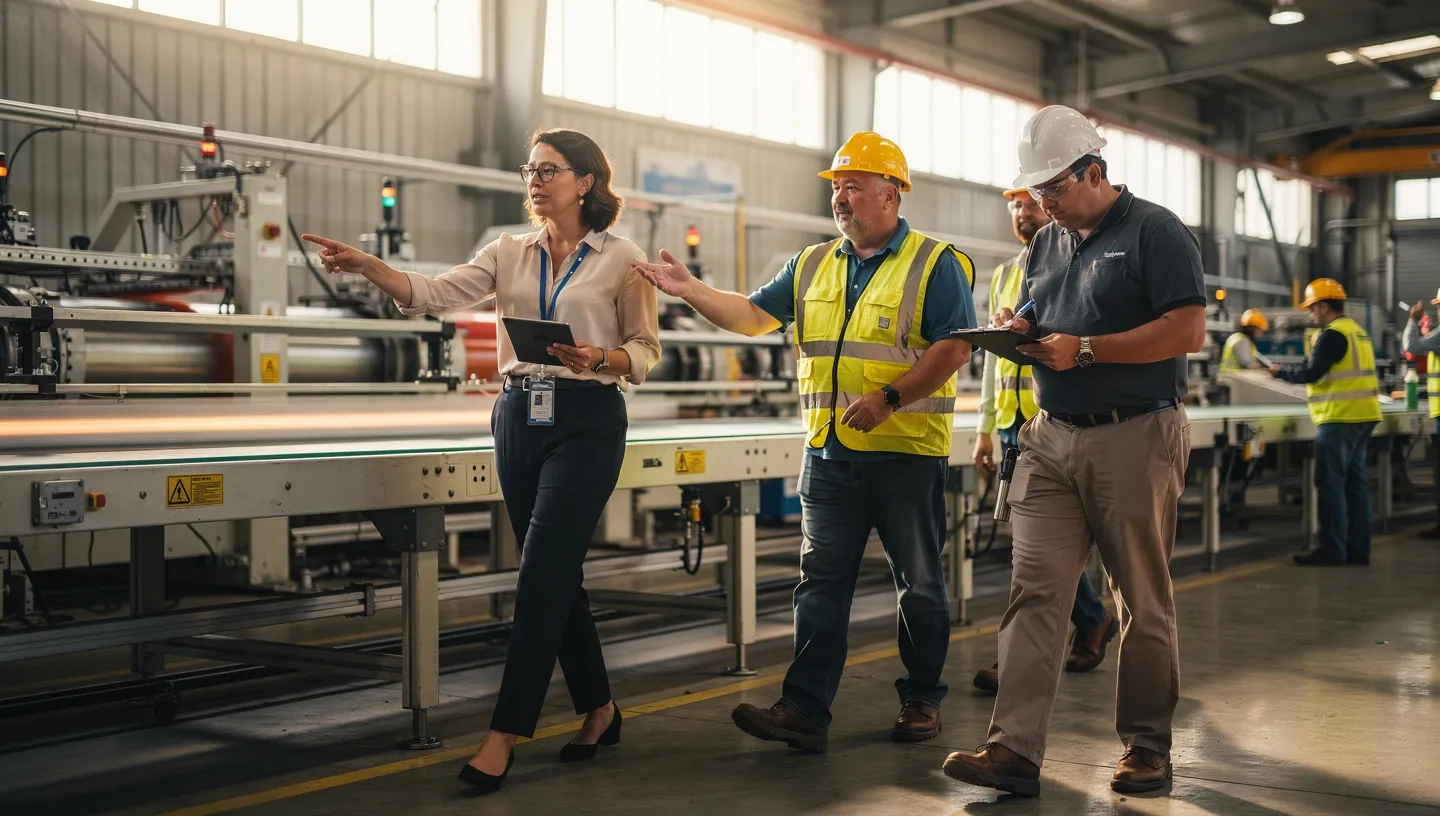
You ran the IWS deployment. You did the Kaizen events. The improvements were real. But six months later, the standards started drifting, the meetings lost structure, and the improvement muscle weakened. The problem was never the methodology. It was that the infrastructure didn't sustain it.
Continuous improvement programs are launched with energy. Consultants come in. Standards are defined. Meeting structures are set up. Loss analyses are conducted. Then the consultants leave.
The Excel trackers stop being updated. The tier meetings lose discipline. The 5S audits become less frequent. The standards drift because there's no system to hold them in place.
When the improvement process depends on discipline rather than architecture, entropy always wins.
Operators capture deviations, safety observations, quality issues, and improvement ideas during their daily work. Each issue includes full context: location, equipment, severity, photos. No separate reporting tool. The data flows into root cause analysis, action tracking, and trend visibility automatically.
"We went from 15 issues reported per month to over 200. Not because things got worse. Because capturing them finally became effortless."CI Manager, Process Manufacturing
Daily stand-ups review yesterday's issues, actions, and KPIs. Weekly reviews track trends. Monthly management reviews look at systemic patterns. Every tier pulls live data from the same system. No preparation. No stale numbers. Issues that can't be resolved at one tier escalate automatically to the next.
Identify, Plan, Execute, Review. Not as a project methodology, but as system architecture that runs every day.
Issues, losses, and improvement ideas captured in context during daily operations.
Issue ManagementRoot cause analysis, action planning, and improvement projects created from real data.
Issue ManagementNew standards deployed as procedures, cascaded into training, enforced in checklists.
Standard WorkLive KPIs at every tier meeting. Trends visible. Did the improvement actually reduce the loss?
Meetings & DashboardsEvery unplanned stop captured with reason codes. Pareto analysis surfaces the top loss drivers. Losses connect to actions and improvement projects. After you implement a fix, you can see in the data whether it actually worked. OEE trends by line, by shift, by product. Native dashboards and Power BI integration.
“We had the IWS methodology. We had the consultants. What we didn't have was a system that held the improvements in place after the project ended. The IPER loop runs on infrastructure now, not on willpower.”Operations Director, European Manufacturer
Multi-site manufacturer. IWS deployment sustained through Maecos. Issue capture increased 12x in first quarter.
Read full story →See how the IPER loop runs on system architecture, not willpower.