What is OEE?
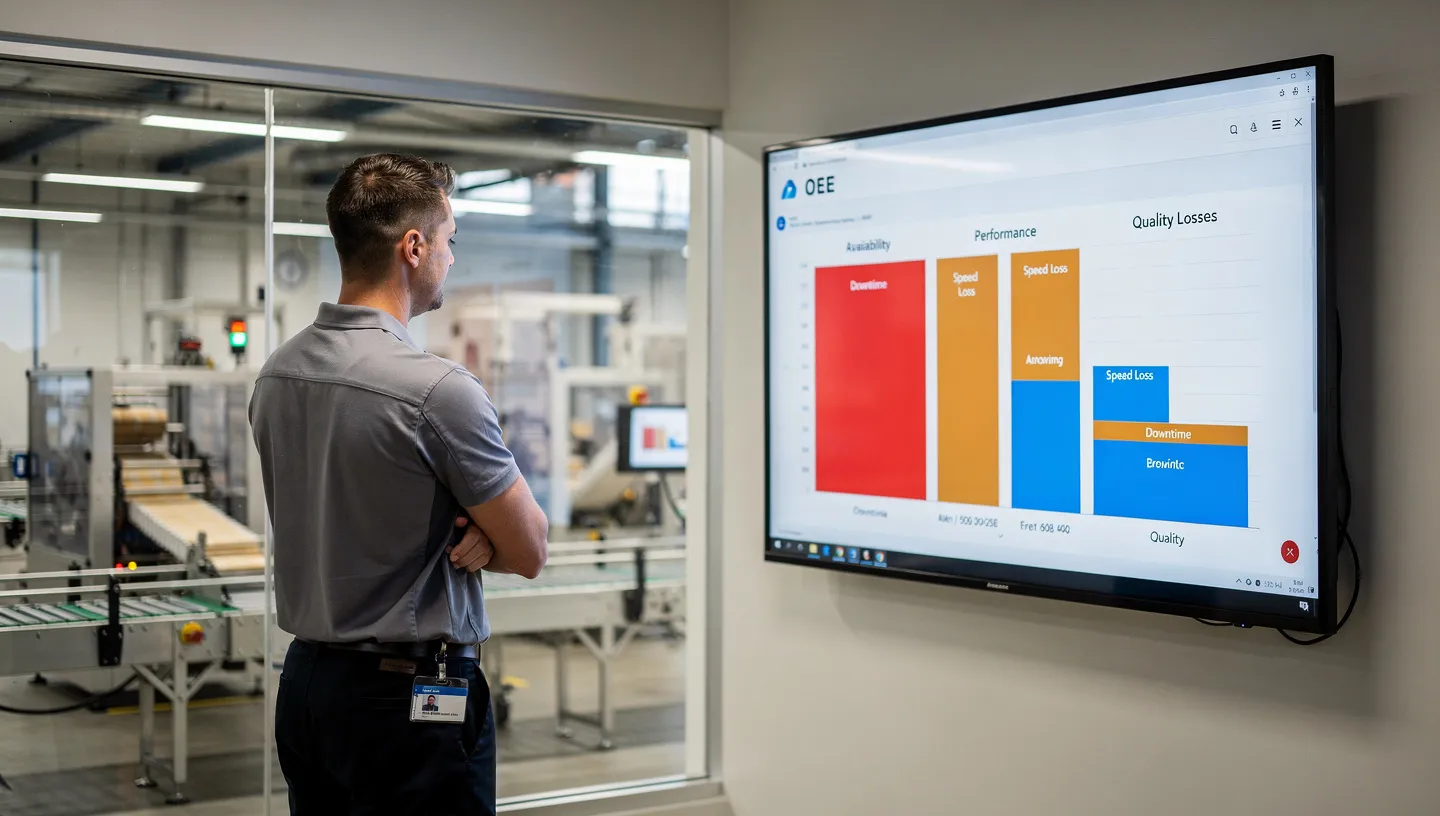
Overall Equipment Effectiveness (OEE) is a metric that measures how well a manufacturing operation uses its equipment. It combines three dimensions into a single percentage: how often the equipment runs when it should (availability), how fast it runs compared to its maximum speed (performance), and how many good parts it produces versus total parts (quality).
OEE was developed by Seiichi Nakajima as part of Total Productive Maintenance (TPM) in the 1960s and 1970s. It became the standard metric for equipment productivity in manufacturing because it captures the full picture in one number, rather than tracking downtime, speed, and scrap separately.
An OEE of 100% means the equipment ran the entire scheduled time, at maximum speed, producing only good parts. In reality, no operation sustains 100%. The gap between actual OEE and 100% represents losses, and those losses are the starting point for improvement.
The three factors
OEE breaks equipment effectiveness into three independent factors. Each captures a different type of loss.
Availability
Actual run time / Planned production time
Measures the percentage of scheduled time that the equipment actually runs. Availability losses include unplanned downtime (breakdowns, material shortages) and planned stops (changeovers, setup, cleaning). If a line is scheduled for 8 hours but only runs for 6.5 hours, availability is 81.3%.
Performance
Actual output / Theoretical maximum output
Measures how fast the equipment runs compared to its designed speed. Performance losses include slow cycles, minor stops (jams, sensor trips, brief interruptions), and any speed reduction. If a machine should produce 100 units per hour but only manages 85, performance is 85%.
Quality
Good units / Total units produced
Measures the proportion of output that meets specification on the first pass. Quality losses include scrap, rework, and startup rejects. If the line produces 1,000 units but 30 are defective, quality is 97%.
The three factors multiply together: OEE = Availability x Performance x Quality. This means losses compound. An operation running at 90% availability, 90% performance, and 99% quality has an OEE of just 80.2%, not 93%.
The six big losses
Nakajima identified six categories of equipment loss that OEE is designed to capture. Every gap between 100% OEE and actual OEE falls into one of these categories:
Equipment failure
Unplanned breakdowns that stop production. Includes mechanical failures, electrical faults, and tooling damage.
Setup and adjustment
Time lost during changeovers, product switches, startup, and any planned adjustment that prevents the equipment from running.
Idling and minor stops
Brief interruptions (typically under 5 minutes): jams, sensor blocks, material feed issues. Individually small, collectively significant.
Reduced speed
Running below the designed cycle time. Caused by equipment wear, operator inexperience, or process constraints that force slower operation.
Process defects
Scrap and rework during stable production. Parts that don't meet specification and must be discarded or reprocessed.
Startup rejects
Defective output during warmup, startup, or the period after a changeover before the process stabilises.
The six big losses framework is useful because it forces specificity. Instead of saying "we had a bad shift," you identify exactly where the time went: 45 minutes of breakdown, 12 minutes of minor stops, and 2.1% scrap.
Calculating OEE
The calculation itself is straightforward. The challenge is getting clean input data.
Planned production time = 480 - 30 = 450 min. Run time = 450 - 40 = 410 min. Availability = 410 / 450 = 91.1%. Performance = (242 x 1.5) / 410 = 88.5%. Quality = 230 / 242 = 95.0%. OEE = 91.1% x 88.5% x 95.0% = 76.6%.
The biggest source of error is the "ideal cycle time" or "nameplate speed." If this number is set too low (because someone once decided the machine can't really run that fast), performance will look artificially high and real speed losses will be hidden. If it's set to the theoretical engineering maximum that's never been achieved, performance will always look bad.
Best practice: set the ideal cycle time to the fastest sustained speed the equipment has demonstrated in normal production. Not a lab test. Not a one-time sprint. The fastest speed that's been sustained for a full production run.
Benchmarks and targets
The commonly cited "world-class OEE" benchmark is 85%, broken down as 90% availability, 95% performance, and 99.9% quality. This number comes from Nakajima's original TPM work and has become an industry reference point.
| OEE range | Interpretation | Typical context |
|---|---|---|
| < 40% | Very low | Common in plants just starting to measure. Lots of low-hanging fruit for improvement. |
| 40 – 60% | Typical starting point | Average for many discrete and process manufacturing operations. Significant improvement potential. |
| 60 – 75% | Reasonable | Systematic improvement underway. Losses are tracked and the biggest ones are being addressed. |
| 75 – 85% | Good | Strong loss management. Approaching world-class. Improvement requires deeper analysis. |
| 85%+ | World-class | Sustained performance at this level indicates mature loss elimination and strong daily management. |
Common mistakes
OEE is a simple concept, but it gets misused in predictable ways:
Hiding losses in planned downtime
If changeovers are classified as "planned downtime" and excluded from the calculation, availability looks great but a major loss is invisible. OEE should include changeovers in the loss picture. Only truly non-production time (breaks, no demand) should be excluded.
Using OEE as a people metric
OEE measures equipment effectiveness, not operator effort. Using it to evaluate or pressure operators creates incentives to game the numbers (underreporting stops, inflating ideal cycle time) rather than fix the actual losses.
Averaging across lines
A plant-level OEE average is meaningless for improvement. It hides the constraint. One line at 95% and another at 55% average to 75%, but the improvement opportunity is entirely on the second line. Always work at the line level.
Measuring without acting
OEE data without a loss analysis process is just a number on a screen. The value of OEE comes from the conversation it triggers: what was our biggest loss today, what caused it, and what are we doing about it.
Using OEE to drive improvement
OEE becomes powerful when it connects to a structured improvement cycle. The process typically follows this pattern:
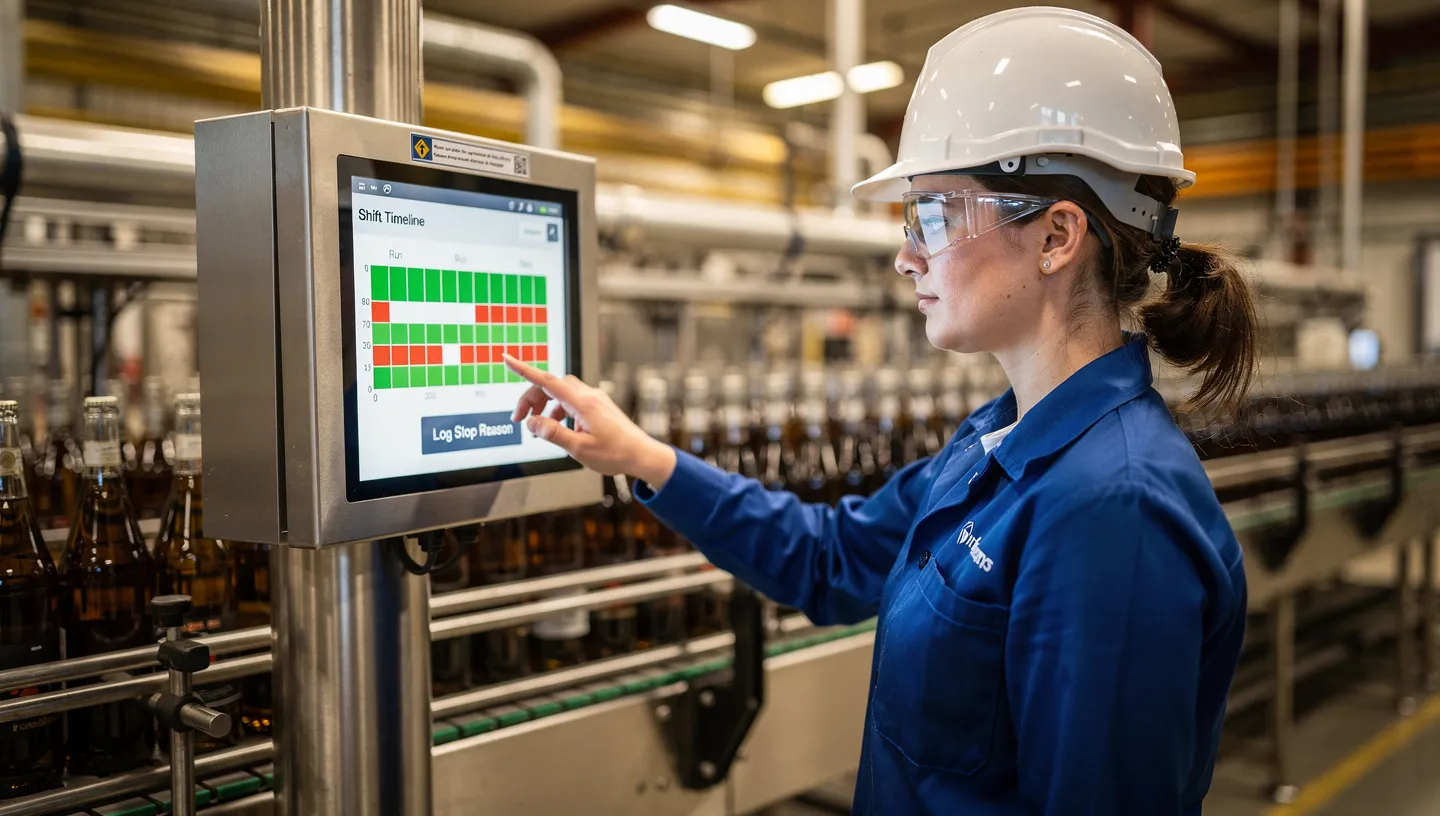
First, measure reliably. Get consistent, honest data for each shift on each line. This alone takes months in most plants, because it requires operators to log stops accurately and agree on definitions (what counts as a breakdown versus a minor stop, what's the ideal cycle time).
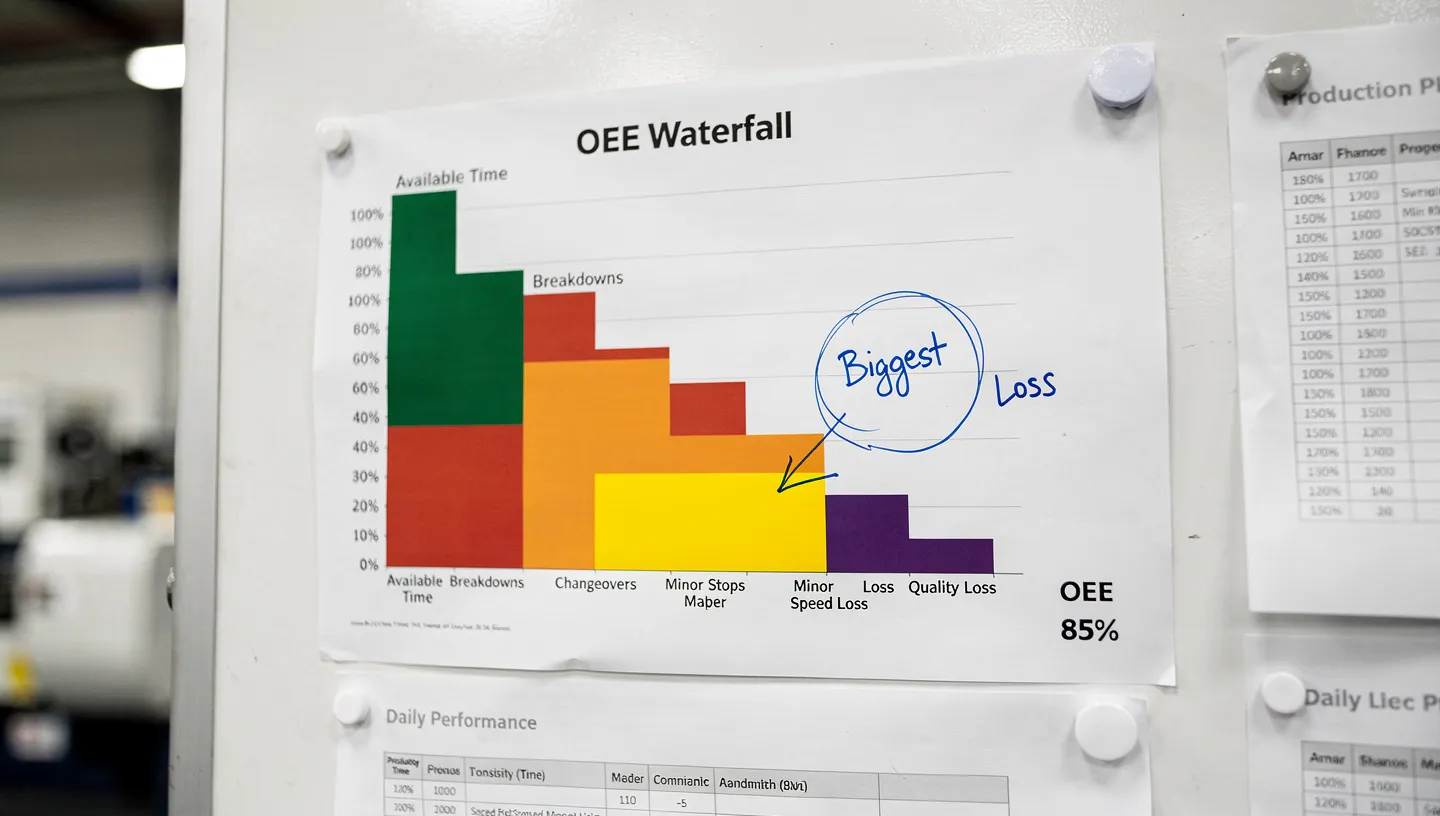
Second, decompose the losses. Use the OEE waterfall to see where the time goes. In most plants, the first pass reveals that one or two loss categories dominate. Often it's changeover time and minor stops, not dramatic breakdowns.
Third, prioritise. Convert losses to cost or time impact. Focus improvement resources on the biggest loss, not the most visible one. A daily 3-minute minor stop that happens 40 times per shift (120 minutes lost) is worse than a monthly 90-minute breakdown.
Fourth, apply structured problem solving. Use the right tool for the right loss: SMED for changeovers, why-why analysis for breakdowns, PM analysis for chronic quality defects, focused improvement for complex multi-causal losses.
Beyond OEE: TEEP and OPE
OEE measures effectiveness during planned production time. It doesn't account for time the equipment wasn't scheduled to run. Two complementary metrics extend the picture:
TEEP (Total Effective Equipment Performance) measures against total calendar time (24/7/365). It shows how much of the theoretical maximum capacity you're actually using. A line running one shift at 85% OEE has a TEEP of roughly 28%. TEEP is useful for capacity planning and investment decisions.
OPE (Overall Process Effectiveness) extends beyond single-equipment measurement to capture losses across an entire process or production line. It accounts for buffer losses, synchronisation issues, and flow constraints that OEE at individual machines misses.
Neither replaces OEE. They serve different purposes. OEE for daily shop-floor improvement, TEEP for strategic capacity assessment, OPE for process-level optimisation.
OEE and digital tools
Traditionally, OEE data was collected manually: operators filled in downtime logs at the end of each shift, and someone in engineering compiled the numbers in a spreadsheet. This approach has two problems. First, the data is inaccurate, because operators estimate stop durations from memory. Second, the data arrives too late, because a weekly OEE report can't drive daily improvement.
Digital OEE systems solve both problems. Automated data collection (from PLCs, SCADA, or sensors) captures stop events and durations in real time. Dashboards make OEE visible to operators and team leaders as the shift progresses, not after it ends.
The most effective implementations combine automated data capture with operator input. The machine knows it stopped for 4 minutes. The operator knows why: a jammed label applicator. Both pieces of information are needed to analyse and eliminate the loss.
Real-time OEE also changes meeting dynamics. Daily direction setting meetings can start with accurate data from the previous shift, showing exactly which losses occurred and how they compare to target. This makes the conversation specific and actionable rather than anecdotal.