Platform · OEE & Dashboards

See what matters. Act on what's off.

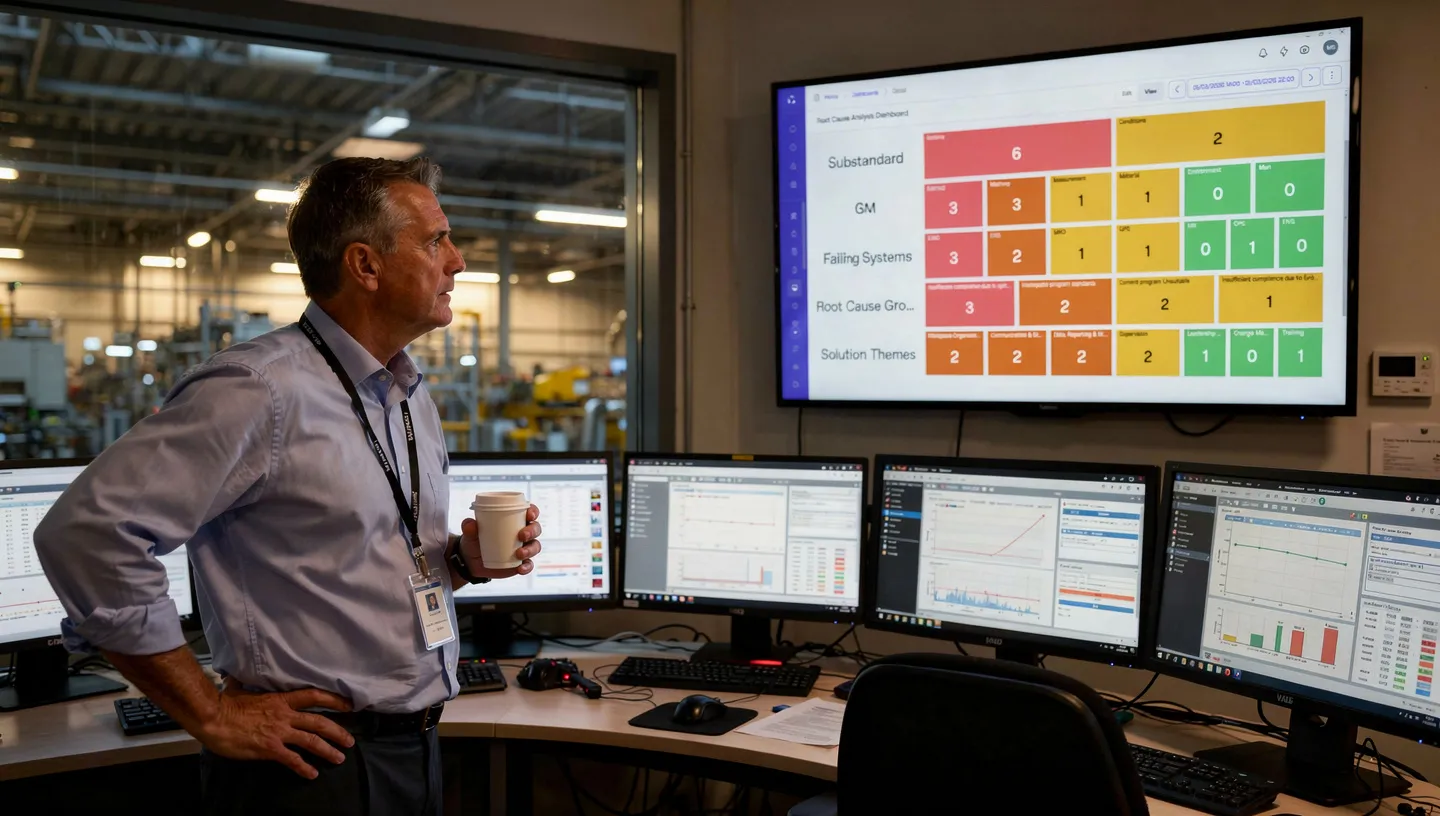
Real-time dashboards that combine operational data, quality metrics, training status, and action progress in one view. Not another BI tool, operational visibility built into the workflow.

Plant director reviewing OEE dashboard on a wall-mounted display in the control room
Real-time operational visibility, no report building, no batch delays
Cross-module production, quality, training, and actions in one view
Power BI compatible native dashboards or feed your existing BI stack

The full picture, not slices from different systems

One dashboard that shows production data alongside training status, action completion, and issue trends. Pre-configured views for OEE, production performance, and quality metrics. Data from Standard Work, Issue Management, Training, and equipment connections, combined in real time. This is what differentiates an operational dashboard from a BI report: it spans the entire operator workflow.

OEEDeviation trendsTraining complianceAction completionEquipment data
Operations Dashboard. Plant A Live · Updated 09:14
OEE, 87.3% (target: 85%) ↑ Above
Open deviations, 7 (3 new today) Review
Training compliance, 94% On track
Overdue actions, 3 Action

From plant overview to shift detail, in two clicks

Drill from plant-level overview to line-level detail to individual shift performance. See where the problems are and where improvement is holding. The plant director sees the big picture. The line lead sees the detail. The operator sees what's relevant. Same data, different views, appropriate for each role.

Plant viewLine viewShift viewRole-based accessDrill-down navigation
Line 4 Detail. Drill-down From plant overview
2 quality deviations overnight Critical
1 action in progress, assigned Open
OEE trend, 83.1% (below target) Review
Training coverage, 100% Good

Dashboards that are ready when you are

Data updates in real time. No pre-building reports. No “the numbers aren’t ready yet.” When the morning meeting starts, the dashboard shows the current state, not yesterday's export. When a deviation is logged at 09:15, it's visible on the dashboard at 09:15. The gap between event and visibility is zero.

Real-time updatesNo export neededNo batch delayEvent-to-dashboard: instant
Operator glancing at a real-time OEE display mounted on production equipment

Your Power BI investment, amplified, not replaced

For organizations already invested in Power BI, Maecos feeds operational data directly into existing dashboards and reports. Your BI team keeps working in their familiar environment. Maecos provides the data pipeline, structured, real-time, and complete. For teams without Power BI, Maecos's native dashboards cover everything.

Power BI data feedNative dashboardsStructured data pipelineNo vendor lock-in
Data Integration Maecos → Power BI
OEE, issues, training, actions, all feeds Connected
Real-time data pipeline, structured Live
BI team uses existing Power BI env. Compatible
Native dashboards for non-BI teams Available
In practice

How Dashboards connect

The plant director opens the morning dashboard. OEE is green across three lines. Line 4 shows a dip, two quality deviations overnight, flagged by Standard Work. She clicks through: both issues are in investigation, one action already assigned.

Training widget shows qualification coverage. Six operators on Line 2 due for retraining by end of week, triggered by last Tuesday's SOP update. Skill Matrix confirms the gap. No manual check needed.

She walks into the morning meeting with facts, not questions.

Module connections
Standard Work Issue Management Training Action Management OEE & Dashboards

The dashboard that took three days to build from exported data. The KPI review that used numbers nobody trusted. The plant manager who spent the first hour of every day pulling reports from four different systems to understand what happened yesterday.

If you need to build the picture before you can act on it, you're already behind.

“I used to spend the first hour of every day pulling data from four different systems. Now I walk into the meeting and the dashboard is ready, live, cross-module, and actionable.”

— Plant Director, Food & Beverage Manufacturing

Common questions

What data feeds into the dashboards?

Data from across the entire Maecos platform. Standard Work (checklist compliance, deviations), Issue Management (issue trends, investigation status), Training (qualification coverage, retraining status), Action Management (open/overdue actions), and equipment connections (OPC-UA/MQTT). It's one view that spans operations and learning.

Can dashboards be customized per role or view level?

Yes. Dashboards are configurable per role, plant directors see plant-level KPIs, line leads see line-level detail, operators see what's relevant to their area. You can drill from plant overview to line to shift. Role-based access ensures everyone sees the right level of detail.

Does Maecos replace Power BI?

It can, but it doesn't have to. Maecos provides native operational dashboards that work out of the box. For organizations invested in Power BI, Maecos feeds data directly into your existing BI environment. You choose the approach that fits your IT landscape.

Is the data real-time?

Yes. Dashboards reflect the current state of operations. When a deviation is logged, it's visible immediately. When an action is closed, the dashboard updates. There's no batch process or nightly sync, the data is live.

Stop building reports. Start acting on them.

Real-time cross-module dashboards, drill-down visibility, and Power BI compatibility, in one system.